THE ILLUSION OF CORRELATION
EXECUTIVE SUMMARY
- The Logic Flaw: The “Lower Rates = Higher Asset Prices” correlation is a vestige of the Easy Money decade; it is a dangerous heuristic in the current era of Fiscal Dominance.
- Institutional Predation: Smart Money utilizes macro data releases (CPI/FOMC) solely for liquidity generation and stop-hunting; they do not use it for directional positioning.
- Historical Precedence: Empirical data demonstrates that a Fed Pivot often signals the onset of a Market Crash rather than a Bull Run; this is specifically true when rate cuts are a response to systemic breakage.
CHAPTER 1: The Pavlovian Trap (Behavioral Arbitrage)
The digital asset market is currently suffering from a severe case of collective delusion.
As of February 2026; Bitcoin has corrected to the $70,000 range; a drawdown exceeding 20% from local highs. The consensus reaction across the spectrum; from X (formerly Twitter) threads to paid signal groups; is uniform: “We need the Fed to cut rates to restore momentum.”
This represents a fatal form of analytical complacency.
Retail investors are exhibiting behavior akin to the subjects in Ivan Pavlov’s experiments: they hear the bell (Rate Cut news) and immediately salivate (Buy). They fail to recognize a critical shift in market structure: in 2026; the bell likely does not signify dinner. It signifies the opening of the abattoir.
The Retail Delusion: Binary Thinking
The primary vulnerability of the retail cohort is Binary Thinking.
- Rates Down = Bullish (Risk-On)
- Rates Up = Bearish (Risk-Off)
This logic held validity during the 2009-2021 epoch due to low inflation and manageable sovereign debt levels. However; applying a 2020 framework to the 2026 market environment is tantamount to capital destruction.
The macro context has shifted from Monetary Dominance (Fed control) to Fiscal Dominance (Sovereign Debt/Deficit control).
If the Federal Reserve cuts rates today; it is likely not a sign of victory over inflation. It indicates that a component of the banking system or the Treasury market has fractured. In a Hard Landing or Recession scenario; risk assets like Bitcoin do not rally. They are liquidated to cover margin calls in traditional equity and credit markets.
Anticipating a rate cut without analyzing the catalyst for said cut is indistinguishable from blind gambling.
Institutional View: Algorithmic Predation
While retail participants refresh economic calendars awaiting CPI prints; Institutional Capital and High-Frequency Trading (HFT) firms are engineering traps.
Institutions are indifferent to a 0.1% variance in CPI. Their primary focus is the location of your Liquidity (Stop Losses).
The Institutional “Stop Hunt” Mechanism:
- The Setup: Prior to FOMC announcements; volatility is artificially suppressed (price compression). Retail traders enter high-leverage positions anticipating a specific direction.
- The Event: Data is released. HFT algorithms process the raw numbers in milliseconds; execution occurs long before human cognition can react.
- The Fake-Out: Price action is driven against the fundamental logic of the news to trigger a Liquidity Cascade (mass triggering of retail Stop Losses). Example: Bullish news releases -> Price dumps 5% to liquidate Longs -> Price reverses upward.
- The Reality: Institutions utilize macro news events as Exit Liquidity. When retail FOMO drives buying volume due to a “Fed Pivot” headline; smart money is distributing (selling) into that strength.
At Corequil; we define this phenomenon as a “News-Based Liquidity Grab.” If your strategy relies solely on the economic calendar; you are not an investor; you are yield for the algorithms.
The False Narrative: Historical Reality Check
Let us examine the data. The narrative that “Fed Pivots always trigger Bull Runs” is a fallacy repeated until it mimics truth.
Financial history reveals a more brutal reality. The following matrix compares market reactions to Rate Cuts across differing economic regimes:
| Era | Rate Cut Catalyst | Economic Condition | Risk Asset Reaction (S&P 500 / BTC) | Status |
|---|---|---|---|---|
| 2000 (Dot Com) | Equity Market Collapse | Recession | CRASH (-50%) post-Pivot | Bear Trap |
| 2007-2008 (GFC) | Banking Crisis | Systemic Recession | CRASH (-57%) post-Pivot | Bear Trap |
| 2019 | Global Slowdown | Stable | Rally (Pre-COVID) | Normal |
| 2020 (COVID) | Pandemic | External Shock | V-Shape Recovery (Due to Massive QE) | Outlier |
| 2026 (Current) | ??? | Stagflation / Debt | ??? | High Risk |
Table Analysis:
Observe the correlation in 2000 and 2008. The Fed cut rates aggressively; yet the market capitulated. The cause: those Rate Cuts were panic responses to a dying economy.
In 2026; with Bitcoin correcting at $70k and prediction markets pricing in cuts; the critical inquiry is this: Is the Fed cutting because inflation is tamed (Bullish); or because the US Bond Market is facing a liquidity crisis (Bearish)?
If the answer is the latter; the positive correlation between Bitcoin and Rate Cuts will decouple. We are entering uncharted territory where holding Cash carries risk parity with holding assets; yet relying on a Fed bailout is a hollow strategy.
The 2020 playbook is obsolete. Burn it.
CHAPTER 2: The “Broken” Money System (Diagnosis: Jeff Park)
With the illusions of the previous cycle incinerated; we must now confront the structural decay of the engine itself: The Federal Reserve’s control console has been severed from the drivetrain.
For the past forty years; Jerome Powell and his predecessors operated with a single; binary lever: Interest Rates.
- Pull the lever up (Hike) = Brake the economy; crush inflation.
- Push the lever down (Cut) = Accelerate growth; inflate assets.
In 2026; this lever is no longer connected to the economic reality. The Monetary Transmission Mechanism has suffered a catastrophic failure. Jeff Park; Head of Alpha Strategies at Bitwise (formerly ProCap); is one of the few institutional voices articulating the unsaid reality: We are approaching the event horizon of “Positive Rho.”
First Principles: The Dead Steering Wheel
Why has the mechanism failed? The answer lies in the arithmetic of the US Sovereign Debt stack; which has now breached $38 Trillion.
In a low-debt regime (circa 1980-2000); raising rates effectively drained liquidity. Borrowing costs surged; corporate expansion halted; consumption slowed; and inflation cooled.
However; under the current regime of Fiscal Dominance; raising rates triggers a lethal paradox.
The US Government is the world’s largest borrower. When the Fed hikes rates to 5%+; the Treasury is mathematically obligated to pay significantly higher interest expenses to bondholders.
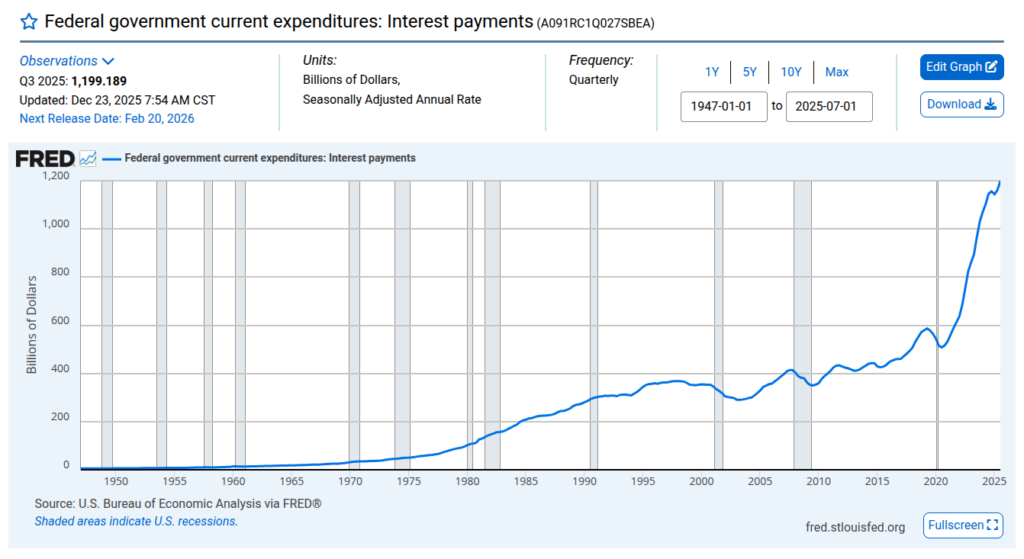
As of February 2026; the US pays over $1.5 Trillion annually solely in interest. This is not credit creation; this is fresh capital injection (deficit spending) flowing directly into the balance sheets of institutions and high-net-worth entities.
The Consequence: The Fed attempts to brake the economy via hikes; yet the Treasury inadvertently sprays trillions in fiscal stimulus to asset holders. It is the monetary equivalent of attempting to extinguish a fire with gasoline.
The “Positive Rho” Theory (Jeff Park’s Thesis)
This paradox forms the core of Jeff Park’s thesis; potentially the “Holy Grail” or Endgame for Bitcoin.
In derivatives finance; Rho ($\rho$) measures an option’s sensitivity to interest rate changes. Traditional risk assets typically exhibit “Negative Rho” (Rates Up -> Asset Prices Down).
Park argues that Bitcoin is evolving into a Positive Rho Asset.
In this paradigm; Bitcoin’s price appreciates in tandem with rising interest rates.
The Mechanism:
- Insolvency Signal: If the Fed hikes rates while debt sits at $38T; the market recognizes the US can never repay the principal in real terms.
- Sovereign Risk Premium: Rate hikes are no longer viewed as “tight money”; they are viewed as signals of Sovereign Default or aggressive currency debasement.
- Capital Flight: Institutional capital does not flee to Cash (USD) because the currency is being diluted to service the debt. Capital flees to Pristine Collateral—assets with zero counterparty risk.
If you observe Bitcoin surging while Powell delivers a Hawkish press conference; do not view it as an anomaly. It is the market repricing Bitcoin as insurance against systemic fiat failure rather than a speculative tech proxy.
Skeptic View: The Deflationary Abyss
Intellectual honesty demands we stress-test this thesis. Will the transition to “Positive Rho” be linear? No.
The primary risk is Timing.
Before the fiscal money printer completely overrides the monetary brakes; we face the risk of a Hard Landing or Deflationary Shock.
If the Fed maintains elevated rates too long before the fiscal mechanism dominates; the commercial banking sector could fracture (reminiscent of the 2023 SVB collapse but on a systemic scale). In a Credit Crunch scenario where lending freezes:
- Secondary market liquidity evaporates instantly.
- Bitcoin (as the only asset trading 24/7 with deep liquidity) becomes the ATM of last resort; sold aggressively to cover Margin Calls in equity and credit markets.
Institutional Verdict:
Jeff Park’s thesis represents the inevitable Long Term (Endgame) trajectory. However; the Short Term (1-3 months) implies extreme volatility. Bitcoin will likely only achieve full “Positive Rho” status once the market is convinced the Fed has lost control and Yield Curve Control (YCC) is the only remaining option.
Until that capitulation point; expect schizophrenic price action. We are in the turbulent transition between monetary regimes.
THE MECHANICS OF FISCAL DOMINANCE
CHAPTER 3: The Interest Expense Spiral (When the Cure Becomes the Disease)
We are witnessing the defining economic paradox of the 21st century; a shift that invalidates the foundational textbooks of modern central banking.
In traditional monetary theory; the equation is linear: Rates Up = Inflation Down. The logic dictates that expensive capital causes credit contraction; demand destruction; and price stabilization.
In 2026; that equation is functionally obsolete.
We now operate under a regime of Fiscal Dominance; where rate hikes paradoxically act as Economic Stimulus. The Federal Reserve; in its desperate attempt to brake inflation; is inadvertently injecting trillions of dollars of fresh liquidity into the system.
This is not conspiracy theory. This is arithmetic.
Mechanics: The $2 Trillion “Stealth” Stimulus
Let us dissect the balance sheet. Do not avert your eyes; these figures are the primary driver of your portfolio’s volatility.
- Total US Debt (2026): ~$36 Trillion+.
- Fed Funds Rate: ~5% (Higher for Longer Scenario).
- Annual Interest Expense: ~$1.8 Trillion per annum.
Grasp the implication: The US Government is mathematically obligated to pay nearly $2 Trillion annually to bondholders.
Where does this capital originate? Since the US runs a perpetual deficit; this capital is created ex nihilo (out of thin air) via new debt issuance.
The Mechanism:
When the Fed holds rates at 5% to “fight inflation”; they force the Treasury to print $1.8 Trillion in new money simply to service the interest payments to investors.
This creates the Interest Expense Spiral:
- The Fed hikes rates to absorb liquidity.
- The Treasury must pay higher coupons on the $36T debt stack.
- These interest payments flood the private sector with fresh cash.
- The economy does not slow down; it overheats due to the income injection.
- The Fed panics and hikes rates further. Repeat Step 1.
The supposed cure (Interest Rates) has mutated into the fuel for the disease (Inflation/Excess Liquidity).
The Wealth Effect: Stimulus for the Balance Sheet
Who receives this $1.8 Trillion in “risk-free” income?
Unlike the COVID-era Stimulus Checks which were distributed to the working class for consumption (groceries/rent); sovereign bond interest flows exclusively to the balance sheets of capital allocators:
- High Net Worth Individuals (Boomers/Pensioners).
- Hedge Funds & Investment Banks.
- Corporations with large cash reserves.
This creates a phenomenon we classify as “The Rich Man’s Stimulus.”
This cohort does not spend this windfall on consumption. They deploy it to acquire assets.
The Liquidity Transmission:
Treasury pays interest -> Deposits into Institutional/Boomer accounts -> Treated as “Disposable Income” -> Re-allocated into Risk Assets (Tech Equities & Crypto).
This answers the fundamental question of why the Nasdaq and Bitcoin remain resilient; or even surge; despite Powell’s hawkish rhetoric. The market is being bid up by the government’s own interest payments.
Institutional Strategy: The Basis Trade & Carry
Smart Money identified this inefficiency in late 2024. They are not fighting the Fed; they are arbitraging fiscal bureaucratic incompetence.
Current institutional strategy focuses on Liquidity Arbitrage:
1. The Treasury Carry
Hedge Funds utilize leverage to acquire short-duration T-Bills yielding 5%. They secure a risk-free return from the government. However; rather than banking the yield; they use these T-Bills as margin collateral to speculate on high-beta assets like Bitcoin.
2. Front-Running The Debasement
Institutions recognize that $1.8 Trillion in new annual supply equals currency Debasement.
Mathematically; if the supply of Dollars expands by 5-10% annually solely due to interest expense; scarce assets (Bitcoin/Gold) must appreciate by at least 10% annually simply to maintain real Purchasing Power.
Institutional View:
Bitcoin is no longer merely a “tech play.” For the sophisticated allocator; Bitcoin acts as a Credit Default Swap (CDS) against US Fiscal Solvency. We are not buying Bitcoin because we like the technology; we are buying it because the US Treasury is trapped in a doom loop of money printing that cannot be halted.
Mechanical Conclusion:
As long as US Debt exceeds $35T and rates remain above 3%; a mathematical price floor exists for risk assets. A secular Bear Market is mathematically impossible when the sovereign treasury is force-feeding liquidity into the system.
CHAPTER 4: The Treasury vs. The Fed (The Monetary Civil War)
While the mechanism described in the previous chapter ensures a liquidity floor; the internal dynamics of Washington present a more volatile risk vector. A forensic audit of the US balance sheet reveals a “Monetary Civil War” currently raging between the two pillars of American finance.
In the blue corner: The Federal Reserve (Jerome Powell).
Mandate: Price Stability (2% Inflation target) and Employment.
Weapon: High Interest Rates (The Economic Brake).
In the red corner: The US Treasury (Janet Yellen).
Mandate: Financing the Deficit to prevent a Government Default.
Weapon: Massive Debt Issuance (The Economic Accelerator).
This policy bifurcation is the primary driver of current market volatility. We are witnessing a vehicle operated by two divergent drivers: one is standing on the brakes with maximum force; while the other is flooring the accelerator.
The outcome is binary: either the engine (The Economy) explodes; or the brakes (The Dollar) capitulate.
Geopolitical Conflict: The TGA Liquidity Pump
Retail investors remain fixated on the theater of FOMC press conferences. Institutional allocators; however; are tracking the TGA (Treasury General Account).
The TGA functions as the government’s checking account at the Fed.
- TGA Balance Increases (Tax receipts/Bond sales) = Liquidity Drain.
- TGA Balance Decreases (Government spending/Payroll) = Liquidity Injection.
The 2025-2026 Phenomenon:
Every time the Federal Reserve attempts to withdraw liquidity via Quantitative Tightening (QT); the Treasury effectively neutralizes the move by draining the TGA or conducting buybacks of short-term debt.
This results in Net Liquidity Neutrality. The Fed’s attempt to extinguish inflation is systematically sabotaged by profligate fiscal spending requirements. For Bitcoin; this policy dissonance is a tailwind. The lack of coordination creates a liquidity gap where non-sovereign hedge assets outperform.
Yield Curve Control (YCC): The Nuclear Option
This represents the nightmare scenario for the US Dollar; yet serves as the “Nuclear Bull Signal” for Bitcoin.
The US Bond Market is staging a rebellion. Foreign creditors (China; Japan) are decelerating their purchases of US debt due to concerns over real solvency. If demand evaporates; bond yields will spike uncontrollably (potentially breaching 6-7% on the 10-Year Treasury).
If yields breach that threshold; the US government faces immediate insolvency due to debt service costs.
The Inevitable Solution: Yield Curve Control (YCC).
The Fed will be forced to capitulate; entering the market to purchase any unsold bonds to artificially cap yields at a lower rate.
Japan (BOJ) attempted this strategy; the Yen collapsed as a result.
If the US implements YCC (officially or via stealth channels); it signals the Fed has surrendered the inflation fight to save the Sovereign.
Bitcoin Implication:
Upon YCC activation; the money supply becomes effectively infinite.
Bitcoin will not reprice linearly; it will reprice exponentially overnight. The market will instantly recognize that the Dollar has transitioned from a store of value to a unit of account subject to infinite dilution.
The Loss of “Risk-Free” Status
For eighty years; the US Treasury Bond was the axiomatic Risk-Free Rate. Global asset valuations (Equities; Real Estate; Gold) are discounted against this benchmark.
In 2026; that status is a myth.
US Treasuries now carry two fatal risk premiums:
- Duration Risk: The risk of capital loss as rates rise (the primary cause of recent banking failures).
- Debasement Risk: The certainty that the purchasing power of the repayment will be significantly lower than the principal loaned.
Bitcoin as Pristine Collateral:
This drives the institutional revolution.
Sophisticated allocators are beginning to view Bitcoin not as a speculative risk asset; but as Pristine Collateral.
- US Treasury: Carries Counterparty Risk (The Government can default or debase).
- Bitcoin: Zero Counterparty Risk. No CEO can dilute shares. No Central Bank can print more than 21 million units.
We are witnessing the real-time transition of global reserve assets. Capital is migrating from dying sovereign debt toward mathematically neutral digital assets. This is not about “Number Go Up”; this is about property rights and solvency in a post-fiat era.
THE NEW INDICATORS
CHAPTER 5: The Net Liquidity Index (NLI) – The True Alpha
While political machinations introduce chaos; markets are ultimately governed by plumbing.
Cease your fixation on interest rate charts. They are lagging indicators; akin to driving via the rearview mirror. To accurately forecast Bitcoin’s trajectory for the coming week; one must audit the central banking “engine room.” You must track Net Liquidity.
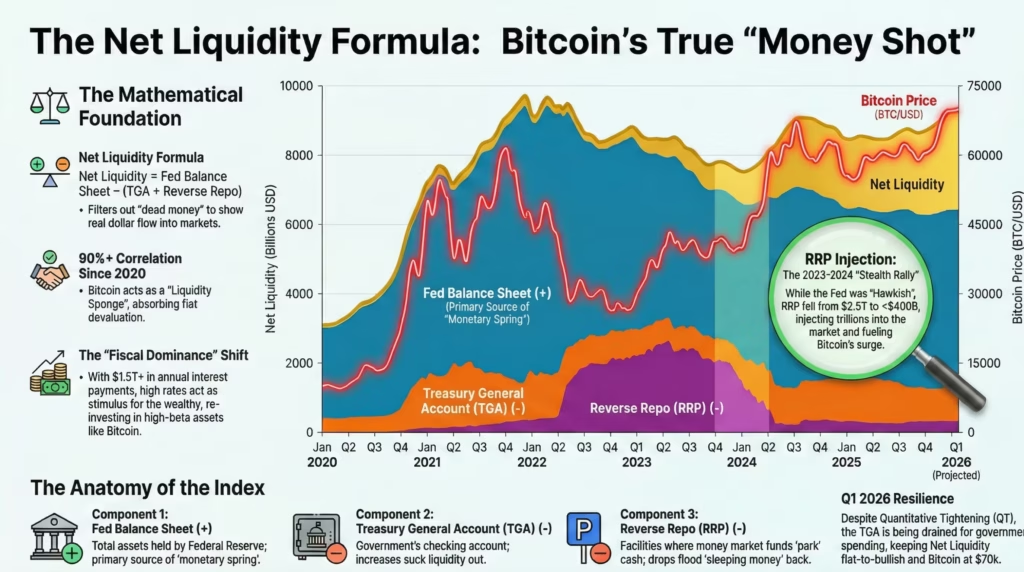
Asset prices are not dictated by Powell’s rhetoric; they are dictated by the quantum of dissolvable Dollars available in the banking system for speculation (speculative float). At Corequil; we utilize a singular absolute metric that has maintained a >90% correlation with Bitcoin price action since the 2020 regime change.
This is the mathematical filter that separates Smart Money from Exit Liquidity.
Definition & Formula: The Holy Trinity
Amateurs track the headline “Fed Balance Sheet” and assume it represents the complete liquidity picture. This is a crude error. Not all capital created by the Fed enters circulation; a significant portion is sterilized or “parked” in non-productive vehicles.
Want Sharper & Deeper Market Analysis?
Get exclusive insights that are logical, comprehensive, and unbiased. Start building your investment strategy based on data, not just assumptions.
To derive Real Net Liquidity; we must subtract this dead capital.
The NLI Formula:
$$Net Liquidity = Fed Balance Sheet – TGA – Reverse Repo (RRP)$$
Let us dissect the components:
- Fed Balance Sheet (+): Total Assets held by the Federal Reserve (The Source).
- TGA (Treasury General Account) (-): The Government’s checking account. If this balance RISES; the government is extracting capital from the private sector (Liquidity Drain).
- Reverse Repo (RRP) (-): The facility where Money Market Funds park overnight cash at the Fed. If this balance RISES; capital is sleeping rather than entering the asset market (Liquidity Drain).
The Logic:
Hypothetically; if the Fed prints $100 Billion (Balance Sheet expands); but simultaneously the Treasury collects $50 Billion in taxes (TGA up) and Banks park $60 Billion in the RRP facility.
- Result: $100 – $50 – $60 = -$10 Billion.
- Conclusion: Despite the Fed “printing;” net liquidity is negative. Bitcoin will correct. This is the nuance the retail cohort fails to grasp.
Forensic Analysis: The Hidden Correlation
Why did the S&P 500 and Bitcoin stage a violent rally in 2023-2024 despite interest rates hitting 20-year highs?
Financial media was baffled. Economists were confused. However; if you overlay the NLI chart; the answer is axiomatic.
During that period; the Reverse Repo (RRP) facility was aggressively drained (plummeting from $2.5 Trillion to sub-$400 Billion). Recall the formula: RRP is a subtractor. If the subtractor shrinks; the final result (Net Liquidity) expands.
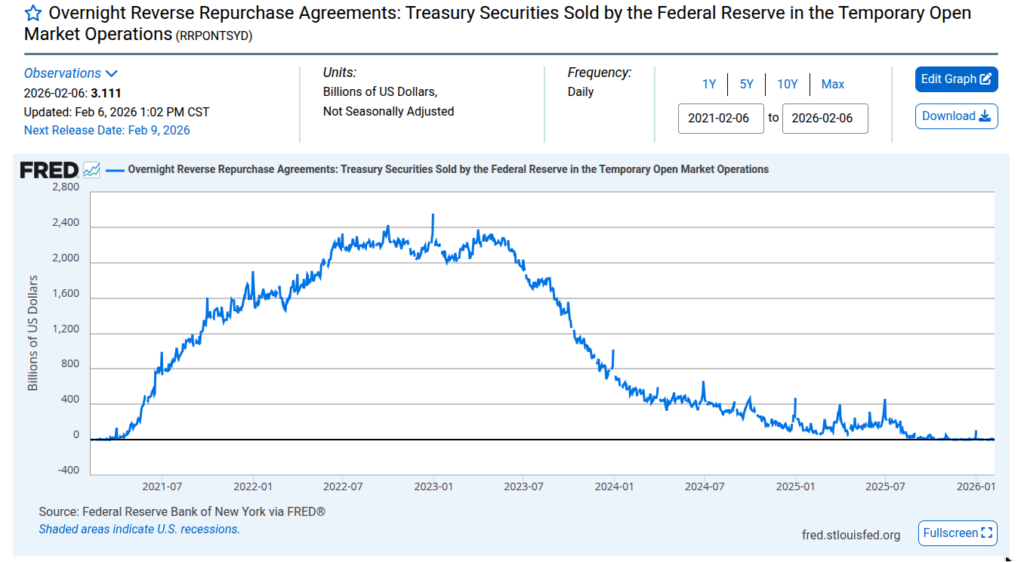
Trillions of dollars previously dormant in the RRP flooded back into the banking system; acting as a floor for asset prices despite Powell’s “Hawkish” screaming.
Correlation Case Study:
- Nov 2021: NLI Peaks -> Bitcoin Top ($69k).
- 2022: Fed executes QT + TGA refills -> NLI collapses -> Bitcoin Crashes to $15k.
- Q1 2026 (Current): We observe a divergence. The Fed Balance Sheet is contracting slightly (QT); but Yellen is draining the TGA for fiscal spending. Net Liquidity is flat to bullish. This dynamic is holding Bitcoin at $70k despite poor macro sentiment.
Bitcoin is the purest Liquidity Sponge in the global market. It lacks Cash Flow; dividends; or a CEO. Its price is a pure reflection of fiat currency debasement divided by the scarce supply of coins.
User Actionable: TradingView Setup
Do not rely on narrative. Hardcode this metric into your terminal immediately. Do not trade without it.
How to Construct NLI on TradingView:
- Open TradingView.
- Enter the symbol search bar.
- Input the following formula exactly (utilizing FRED data):
FRED:WALCL - FRED:WTREGEN - FRED:RRPONTSYD
Signal Interpretation:
- NLI Trend Up: Green Light. Buy the Dip. Ignore FUD. Capital flows are net positive.
- NLI Trend Down: Red Light. Sell the Rip. De-leverage. Capital is being extracted.
- Divergence: If Bitcoin prints a Higher High; but NLI prints a Lower High; this is a high-probability Top Signal. Exit positions immediately.
From this day forward; utilize NLI as your primary investment filter. If NLI indicates “Sell” but your favorite influencer screams “Buy”; trust the arithmetic; not the human.
CHAPTER 6: Shadow Banking Support (The Hidden Pivot)
However; while the Net Liquidity Index serves as the visible dashboard; the real distress is often concealed within the plumbing. To fully understand the liquidity picture; one must audit the Shadow Banking Support mechanisms—the opaque backchannels where banking panic is sterilized from public view.
In March 2023; the Federal Reserve engineered an emergency facility designated the BTFP (Bank Term Funding Program) to bail out Silicon Valley Bank and its peers. Essentially; the Fed declared: “Surrender your distressed, underwater bonds; and we will value them at 100% (par value) against fresh cash.”
The BTFP officially shuttered in March 2024. Yet; in 2026; the “Specter of BTFP” remains active under new nomenclature.
The rationale is structural: the fundamental insolvency issue—holding low-yield vintage bonds in a high-yield regime—remains unresolved. The insolvency has not been cured; it has merely been obfuscated via accounting regulatory forbearance.
Context: The Discount Window & SRF (The New Emergency Spigots)
With the BTFP offline; distressed depository institutions in 2026 have migrated to two “shadow” liquidity facilities:
- The Discount Window (Primary Credit): The Fed’s “lender of last resort” window. Historically; borrowing here carried severe Stigma. Today; it is standard operating procedure for survival.
- SRF (Standing Repo Facility): A permanent facility allowing banks to monetize Treasuries for cash instantly without liquidating them on the open market (which would crash prices).
This constitutes Shadow QE.
The Fed refuses to label it “Quantitative Easing” (money printing). They utilize the euphemism “Liquidity Support.” The monetary effect; however; is identical: The Fed’s balance sheet expands; and fresh Dollars dilute the system.
The Signal: Bad News is Good News (Again)
This provides the most potent contrarian indicator for Bitcoin.
Every Thursday afternoon (ET); the Federal Reserve publishes its weekly balance sheet data (The H.4.1 Release). Institutional analysts immediately parse the line item labeled: “Loans to Depository Institutions.”
- If this figure Spikes: It indicates a bank is near insolvency and aggressively tapping Fed liquidity.
- Retail Reaction: Panic (“Banking Crisis! Sell Equities!”).
- Bitcoin Reaction: PUMP.
The Transmission Logic:
Banking Crisis = Fed Panic -> Emergency Liquidity Injection -> Fiat Supply Expansion -> Trust in Counterparties Collapses -> Bitcoin (Non-Sovereign Asset) Rallies.
Recall March 2023: Three major US banks collapsed; yet Bitcoin surged from $19k to $30k in a fortnight. That was not a coincidence. That was the market pricing in the inevitable Bailout.
In 2026; if you observe a surge in Discount Window usage; do not flee to Cash. Flee from Cash into Hard Assets.
Institutional View: The “Walk of Shame”
Major institutions track this data via automated scraping algorithms.
In previous cycles; a “Walk of Shame” stigma existed for banks tapping the Discount Window. If a bank was exposed as a borrower; short-sellers would hunt the stock to zero.
Our intelligence indicates that in 2026; this stigma has evaporated. The “Too Big To Fail” banks have lobbied to normalize emergency borrowing.
The Implication:
The US banking system is on permanent “Life Support.” It cannot function without daily liquidity infusions from the central bank.
As a Corequil allocator; you must cease viewing banking crises as systemic risks that will suppress Bitcoin price action. Conversely; banking fragility is Bitcoin’s Premier Value Proposition. The more fragile the fiat banking layer; the stronger the argument for Self-Custody.
Do not fear bank failure headlines. Fear only if the Fed ceases the bailouts (a political impossibility). As long as the monetary morphine flows; the asset party continues atop a fractured foundation.
CHAPTER 7: The Sovereign Canary (CDS & Counterparty Risk)
If the Shadow Banking system (Chapter 6) represents the plumbing; the Sovereign Debt market represents the foundation. And right now; the concrete is cracking.
While Net Liquidity tells us how much money is circulating; Credit Default Swaps (CDS) reveal the quality of that money.
The canary in the coal mine has ceased singing. If you cannot hear the silence; you are positioned on the wrong side of the upcoming volatility event.
Mechanics: Betting Against the House
To understand the endgame; one must understand the Credit Default Swap (CDS). In layman’s terms; it is an insurance policy against bankruptcy. If you hold a bond and the issuer defaults; the CDS seller makes you whole.
For a century; purchasing CDS protection on US Treasury debt was considered burning capital. Who bets against the United States? The US possesses the printing press; making nominal default theoretically impossible.
However; in 2026; the cost of this insurance has spiked.
The global derivatives market—populated by the most sophisticated institutional risk managers—is now demanding higher premiums to insure US sovereign debt than the debt of certain cash-rich technology corporations.
The Implication:
The market is pricing in a non-zero probability of “Technical Default” or “Involuntary Restructuring.” This signifies the erosion of the “Full Faith and Credit” doctrine. When US CDS premiums rise; the market is whispering the quiet part out loud: “The Emperor has no clothes.”
Correlation Study: The Solvency Hedge
Why is this relevant to your crypto allocation?
There exists a near-perfect inverse correlation between confidence in the Dollar’s solvency and the price of Hard Assets.
The Price Transmission Mechanism:
- US CDS Spikes: Institutions panic that Treasuries (their primary collateral) are tainted.
- Flight to Safety: Capital seeks assets with Zero Counterparty Risk.
- The Divergence: Capital does not flee to the Euro or Yen (which face identical sovereign debt crises). It flees to Gold and Bitcoin.
On-chain data and derivatives flow confirm a new pattern:
Every time the US 1-Year CDS spread widens (indicating near-term distress); Bitcoin experiences aggressive institutional bidding.
In the eyes of Smart Money; Bitcoin has transitioned from a “Risk-On Asset” (like a tech stock) to an “Insurance Asset” (like Gold). If the Titanic (US Treasury) takes on water; the lifeboats (Bitcoin) become the most valuable assets in the ocean.
Strategic Edge: Reading The True “Fear Gauge”
Discard the VIX (Equity Volatility Index). That is a metric for amateurs. The VIX merely measures the anxiety of stock traders.
The true indicator of systemic rupture is the US 1-Year CDS Spread.
The Corequil Tactical Guide:
Monitor the US Sovereign CDS ticker on your Bloomberg terminal or institutional data feed.
- Status Normal (Green Zone): Spread is flat/low. The market trusts the Fed has control. Bitcoin correlates with the Nasdaq.
- Status Alert (Yellow Zone): Spread begins a gradual ascent. Institutions are hedging. This is the optimal Bitcoin accumulation zone.
- Status Critical (Red Zone): Spread goes Parabolic (Vertical Spike).
- This signals a “Solvency Event” is occurring behind the curtain.
- Equities may flash-crash due to a liquidity vacuum.
- HOWEVER: This is the rocket fuel for Bitcoin to breach All-Time Highs. Why? Because the only mechanism to save a defaulting bond market is Hyper-Liquidity (infinite money printing).
Do not wait for the narrative to hit CNBC. By the time the news anchor reads the teleprompter; the CDS spread will have normalized and the trade will be crowded. The CDS market leads the headlines by 2-3 weeks.
THE STRATEGIC PLAYBOOK
CHAPTER 8: The Great Decoupling (The Regime Shift)
For the past decade; Bitcoin critics have relied on a single; irrefutable argument: “Bitcoin is merely a high-beta technology stock.”
To be intellectually honest; they were correct. Since 2020; the correlation coefficient between Bitcoin and the Nasdaq 100 (QQQ) has hovered near +0.8. If Apple and Nvidia corrected; Bitcoin was dragged into the abyss alongside them.
However; February 2026 data indicates a terrifying yet opportunistic anomaly. The correlation tether is fraying. We are staring at The Great Decoupling.
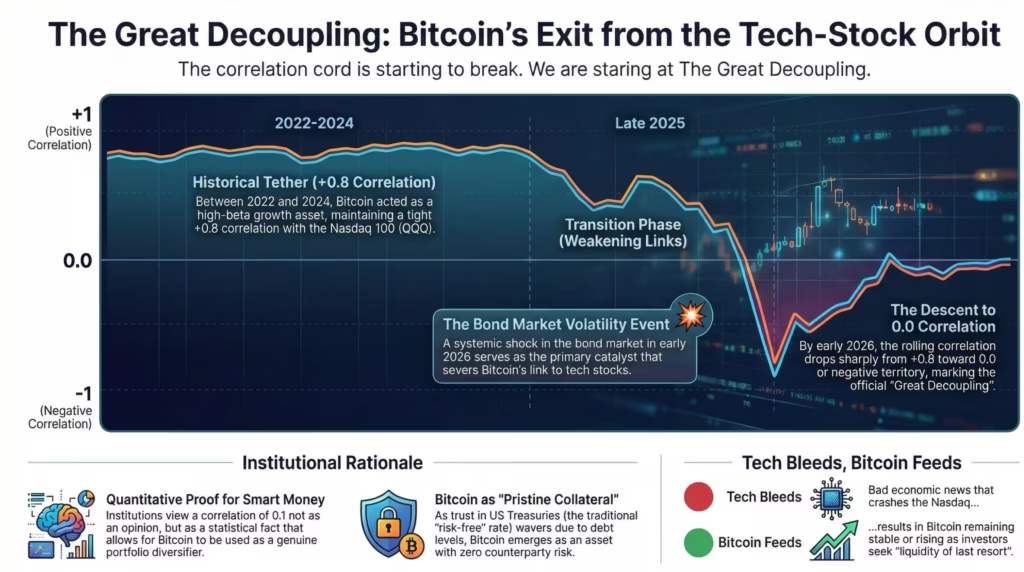
The Pattern: When Tech Bleeds, Bitcoin Feeds
How does one identify this historic pivot? Ignore the USD price. Focus exclusively on the BTC/NDX Ratio (Bitcoin relative to Nasdaq 100).
In a Standard Regime:
- Macro Headwinds -> Nasdaq Correction -> Bitcoin Corrects Harder (High Beta).
In a Decoupling Regime:
- Macro Headwinds (e.g., Banking Failure) -> Nasdaq Correction -> Bitcoin Stabilizes or Rallies.
This pattern flashed briefly during the March 2023 Banking Crisis; and it is re-emerging in early 2026 as the bond market fractures. This signals that Smart Money is re-pricing Bitcoin.
Allocators are no longer viewing it as a “Growth Asset” dependent on a booming economy. They are beginning to view it as a “Hedge Asset” that outperforms when the fiat system catches fire. This transition from Risk-On to Risk-Off is the catalyst for a multi-trillion dollar valuation shift.
Bull Case: The Liquidity of Last Resort
The most extreme Bullish scenario for Bitcoin is not a spot ETF or retail adoption. The scenario is Sovereign Bond Illiquidity.
Consider this scenario (which is already occurring in fractional terms):
The US Treasury market seizes up. There are no buyers for US debt. Spreads widen violently. Interbank lending freezes due to counterparty fear. The equity market triggers a Circuit Breaker and halts trading to prevent panic.
Where do you move capital on a Sunday night when banks are shuttered and the bond market is illiquid?
There is only one asset class that:
- Operates 24/7/365 without intermission.
- Possesses billions in daily global liquidity.
- Offers Final Settlement in 10 minutes without a central bank intermediary.
In a systemic liquidity crisis; Bitcoin becomes The Liquidity of Last Resort. Other assets may have “paper value” but are functionally illiquid. Bitcoin can be liquidated and transmitted instantly. This liquidity premium will trigger a vertical price repricing when the exits for traditional assets are welded shut.
The Verdict: 6-12 Month Timeline
Based on the Net Liquidity data (Chapter 5) and CDS signals (Chapter 7); we project the following high-probability roadmap for the remainder of 2026:
- Q1-Q2 2026 (The Chop): Brutal volatility. The Fed attempts to “talk tough” and hold rates. Bitcoin will trade in a wide range; attempting to break the Nasdaq correlation. Retail leverage traders will be liquidated here (The “Shakeout” Phase).
- The Trigger Event: One of three catalysts occurs:
- Another US Regional Bank collapse.
- A failed US Treasury Auction (Tail risk realized).
- Japan dumping US Treasuries to defend the Yen.
- Q3-Q4 2026 (The Vertical Move): The Fed is forced into YCC or full-scale Shadow QE. At this inflection point; the BTC/Nasdaq correlation snaps. Equities may stagnate under stagflation; but Bitcoin and Gold enter aggressive Price Discovery mode as the market realizes Debasement is the only remaining policy tool.
Conclusion: We are in the transition phase. Do not gamble with high leverage in Q2. Accumulate spot; secure it in cold storage; and wait for the fiat system to press its own panic button.
CHAPTER 9: Institutional Front-Running (The Execution Layer)
We have conducted a forensic autopsy of the global financial system from Chapters 1 through 8. You now understand that interest rates are a lagging mirage; liquidity is the monarch; and sovereign solvency is a ticking time bomb.
Now; the million-dollar question: How do you position your capital at the open?
Information without execution is hallucination. Institutions do not win because they possess superior intellect; they win because they Front-Run the narrative before retail participants realize the game has changed.
This is the Corequil Tactical Playbook designed to position you on the right side of history; ahead of the Wall Street whales.
Actionable Strategy: The “Liquidity First” Protocol
Cease the retail fixation on lower-timeframe price action. Checking Bitcoin’s price every five minutes is amateur behavior. Your routine must undergo a structural pivot.
We have distilled complex macro mechanics into a binary Traffic Light System based on the Net Liquidity Index (NLI) and Credit Default Swaps (CDS).
Step 1: The Thursday Ritual (The Fuel Gauge)
Every Thursday afternoon (upon the Fed’s H.4.1 release); audit the NLI (Chapter 5).
- If NLI Expands >$20 Billion/week: The system is being injected. Execute Aggressive DCA or deploy Lump Sum capital. Disregard negative media narratives.
- If NLI Contracts >$20 Billion/week: The system is being drained. Halt allocation. Accumulate Cash to bid the inevitable dip.
Step 2: The Solvency Check (The Hull Integrity)
Every Monday morning; audit the US 1-Year CDS (Chapter 7).
- If CDS is Flat: Condition Green. Focus on standard sector rotation.
- If CDS Spikes Vertically: This is the “Decoupling” signal. Liquidate high-beta assets (Altcoins/Tech Equities) and rotate fully into Bitcoin & Gold. This is the precise moment correlation breaks.
Step 3: Ignore The Noise
Delete news applications that push “Breaking News” notifications regarding Fed speeches. Institutional algorithms react 0.05 seconds after the headline hits the wire. If you are reacting to the news; you are their Exit Liquidity. Focus solely on the liquidity data (the money); not the narrative (the mouth).
Risk Management: The “Kill Switch”
Regardless of the conviction behind the Corequil thesis; the market remains a probabilistic beast. We must define the Invalidation Point.
When do you capitulate on Bitcoin and flee to Cash (USD)?
The “Volcker 2.0” Scenario (Pure Deflation):
This occurs if the Fed decides to bankrupt the US Government to murder inflation.
- The Signal: Bond market crashes; banks fail; BUT the Fed REFUSES to print money or open emergency facilities (Discount Window/SRF).
- The Effect: NLI freefalls without a floor.
- The Action: Liquidate ALL risk assets. In a pure deflationary collapse; Cash is King. Bitcoin will be crushed temporarily before a multi-year recovery.
However; the political probability of this scenario approaches Zero. No politician will oversee a sovereign default on their watch. They will invariably choose inflation (money printing) over deflation (bankruptcy).
Closing Thought: The Era of Active Survival
The era of the passive “60/40” Portfolio (60% Stocks; 40% Bonds) is dead and buried. You can no longer allocate to an index; sleep soundly; and expect a wealthy retirement.
We are living through The Great Repricing.
The purchasing power of the fiat currency in your wallet is being intentionally liquefied by monetary architects to service the debts of the past.
Becoming a “Macro Investor” is no longer a hobby; it is a survival mechanism.
- Those blind to liquidity will see their wealth eroded by inflation and volatility.
- Those who understand Fiscal Dominance will utilize volatility as a ladder.
The fiat system is broken. Do not attempt to fix it. Do not mourn it.
Exploit the fracture.
Be the one holding the lifeboat when the Titanic begins to list.
See you on the other side.
Disclaimer: The content provided by corequil.com is for information and education purposes only and is not intended as investment or financial advice. Please do your own research (DYOR) as your actions are your own responsibility. Check the Terms and Conditions for more information.